Morpho Vault Ratings: Step-by-Step Example
In this section, we walk through how Credora rates Morpho vaults using Spark’s curated vaults as examples, an analysis with data from June 2025. These Spark vaults are part of the Spark Liquidity Layer, which automates the deployment of USDS, sUSDS, and USDC liquidity across DeFi protocols.
Here’s a snapshot of the current rating outcomes for two Spark vaults, where PSL refers to the annualized Probability of Significant Loss (defined as a 1% loss):
| Vault | Network | Loan Asset | Rating | PSL |
|---|---|---|---|---|
| Spark DAI Vault | Ethereum | DAI | A- | 0.50% |
| Spark USDC Vault | Base | USDC | A | 0.18% |
Step 1: Classifying Markets
We begin by analyzing the markets that a vault is exposed to. This starts with classifying each market’s oracle structure — essentially, how prices are determined.
Morpho markets fall into three oracle categories:
- Dynamic: Prices update frequently based on real-time trading.
- Exchange: Prices are derived from protocol-level exchange or redemption rates.
- Hardcoded/Fixed: Prices have material core assumptions, typically considering the collateral asset as equivalent in price to another asset (e.g. USDe = USDC).
Oracle classification is based on a review of the asset pair and the underlying Morpho oracle contracts.
Spark DAI
| Collateral Asset | PD | Oracle | LLTV | WA LTV |
|---|---|---|---|---|
| PT-USDS 14AUG2025 | 0.76% | Exchange | 96.5% | 90% |
| PT-sUSDE 31JUL2025 | 1.08% | Fixed | 91.5% | 79% |
| PT-eUSDE 29MAY2025 | 1.08% | Fixed | 91.5% | 76.5% |
| PT-USDe 31JUL2025 | 1.08% | Fixed | 91.5% | 62% |
| sUSDe | 0.94% | Fixed | 86% | 50% |
| USDe | 0.94% | Fixed | 86% | 75.5% |
| PT-sUSDE 29MAY2025 | 1.08% | Fixed | 91.5% | 83% |
| PT-sUSDE 27MAR2025 | 1.08% | Fixed | 91.5% | 76.5% |
| Unallocated |
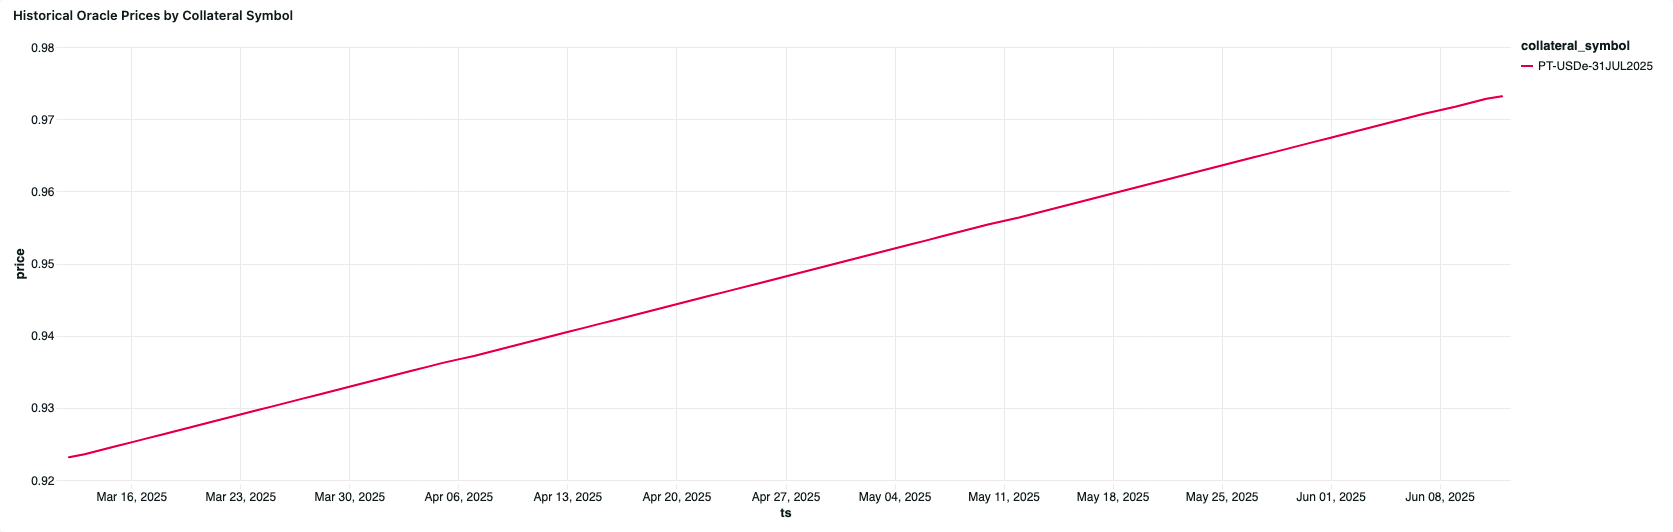
In the case of PT-USDE-31JUL, the oracle configuration only utilizes a base feed, which is a PT linear discount adapter. Although linear adapters typically underprice PT fair values, the configuration assumes USDE = 1, and thus the fixed classification applies. We can inspect historical pricing per oracle configuration.
Spark USDC
| Collateral Asset | Consensus PD | Oracle | LLTV | WA LTV |
|---|---|---|---|---|
| cbBTC | 0.02% | Dynamic | 86% | 48% |
- Consensus PD of the collateral asset considers Credora methodology outputs and expert reviewer input.
- LLTV is the liquidation loan-to-value.
- WA LTV is the weighted average LTV across all active positions.
Step 2: Quantifying Market Risk
The next step is quantifying lending market risk based on oracle type:
- Fixed: Focus on extreme loss scenarios, considering Loss Given Default (LGD) curves.
- Dynamic & Exchange: Use Monte Carlo simulations to evaluate price path risk.
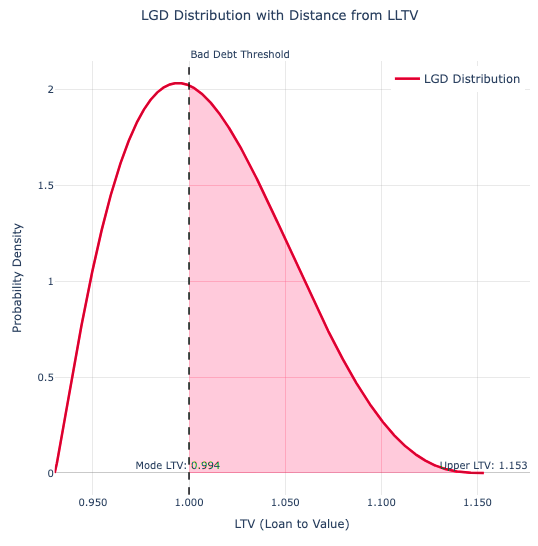
Fixed Oracles: What drives bad debt?
Even where the price is static:
- Liquidations can occur due to rising interest rates lowering borrower health factors, where the fair value of the collateral asset may differ versus the oracle price.
- Bad debt can occur if the oracle misprices the asset (e.g. during a depeg event), enabling undercollateralized borrowing.
The LGD curve below visually explains the PSL calculation for Fixed markets.
PT-sUSDE-31JUL2025
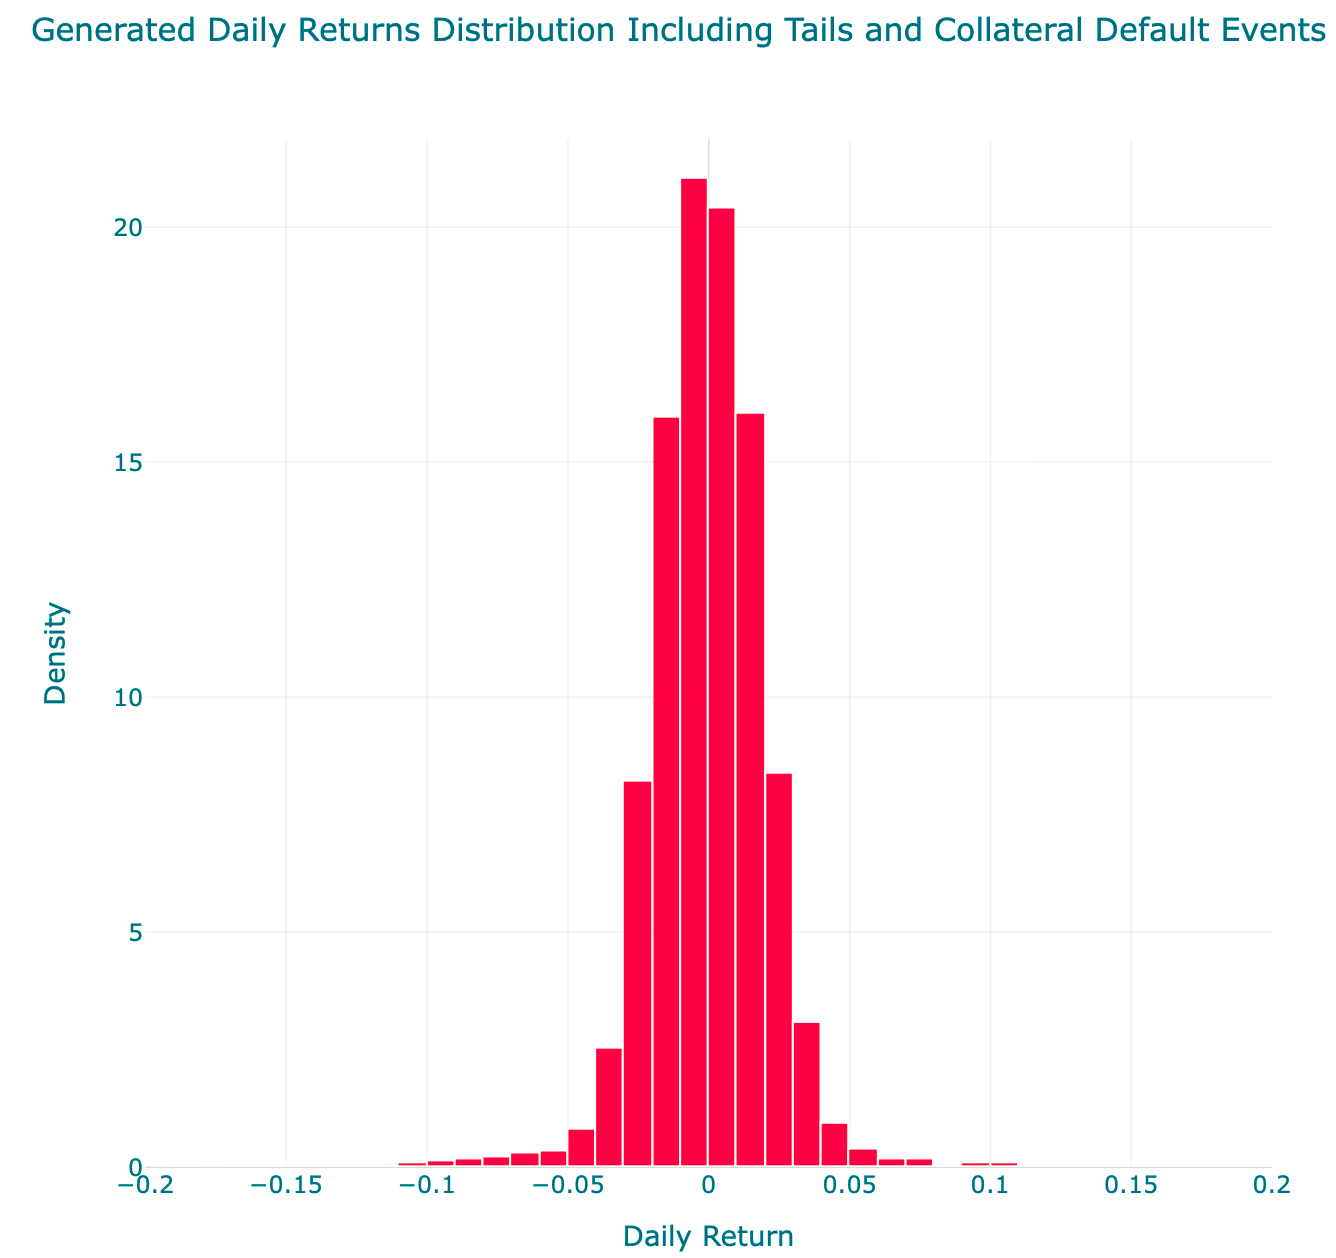
Simulating Price Paths
To run simulations, we first model the distribution of asset returns:
- 30-day Volatility: Captures normal price fluctuations.
- Historical Tail Events: Accounts for rare but extreme market movements.
- Collateral Asset PD & LGD: Inserts expected default events, derived from the collateral asset consensus PD and LGD distribution. In simple terms, how often will there be a default event, and how would that impact the price.
Using this data, we simulate 100,000 independent price paths. The below displays the distribution of daily returns for USDC/cbBTC.
Utilizing the distribution as an input, we simulate potential price for 35 days.
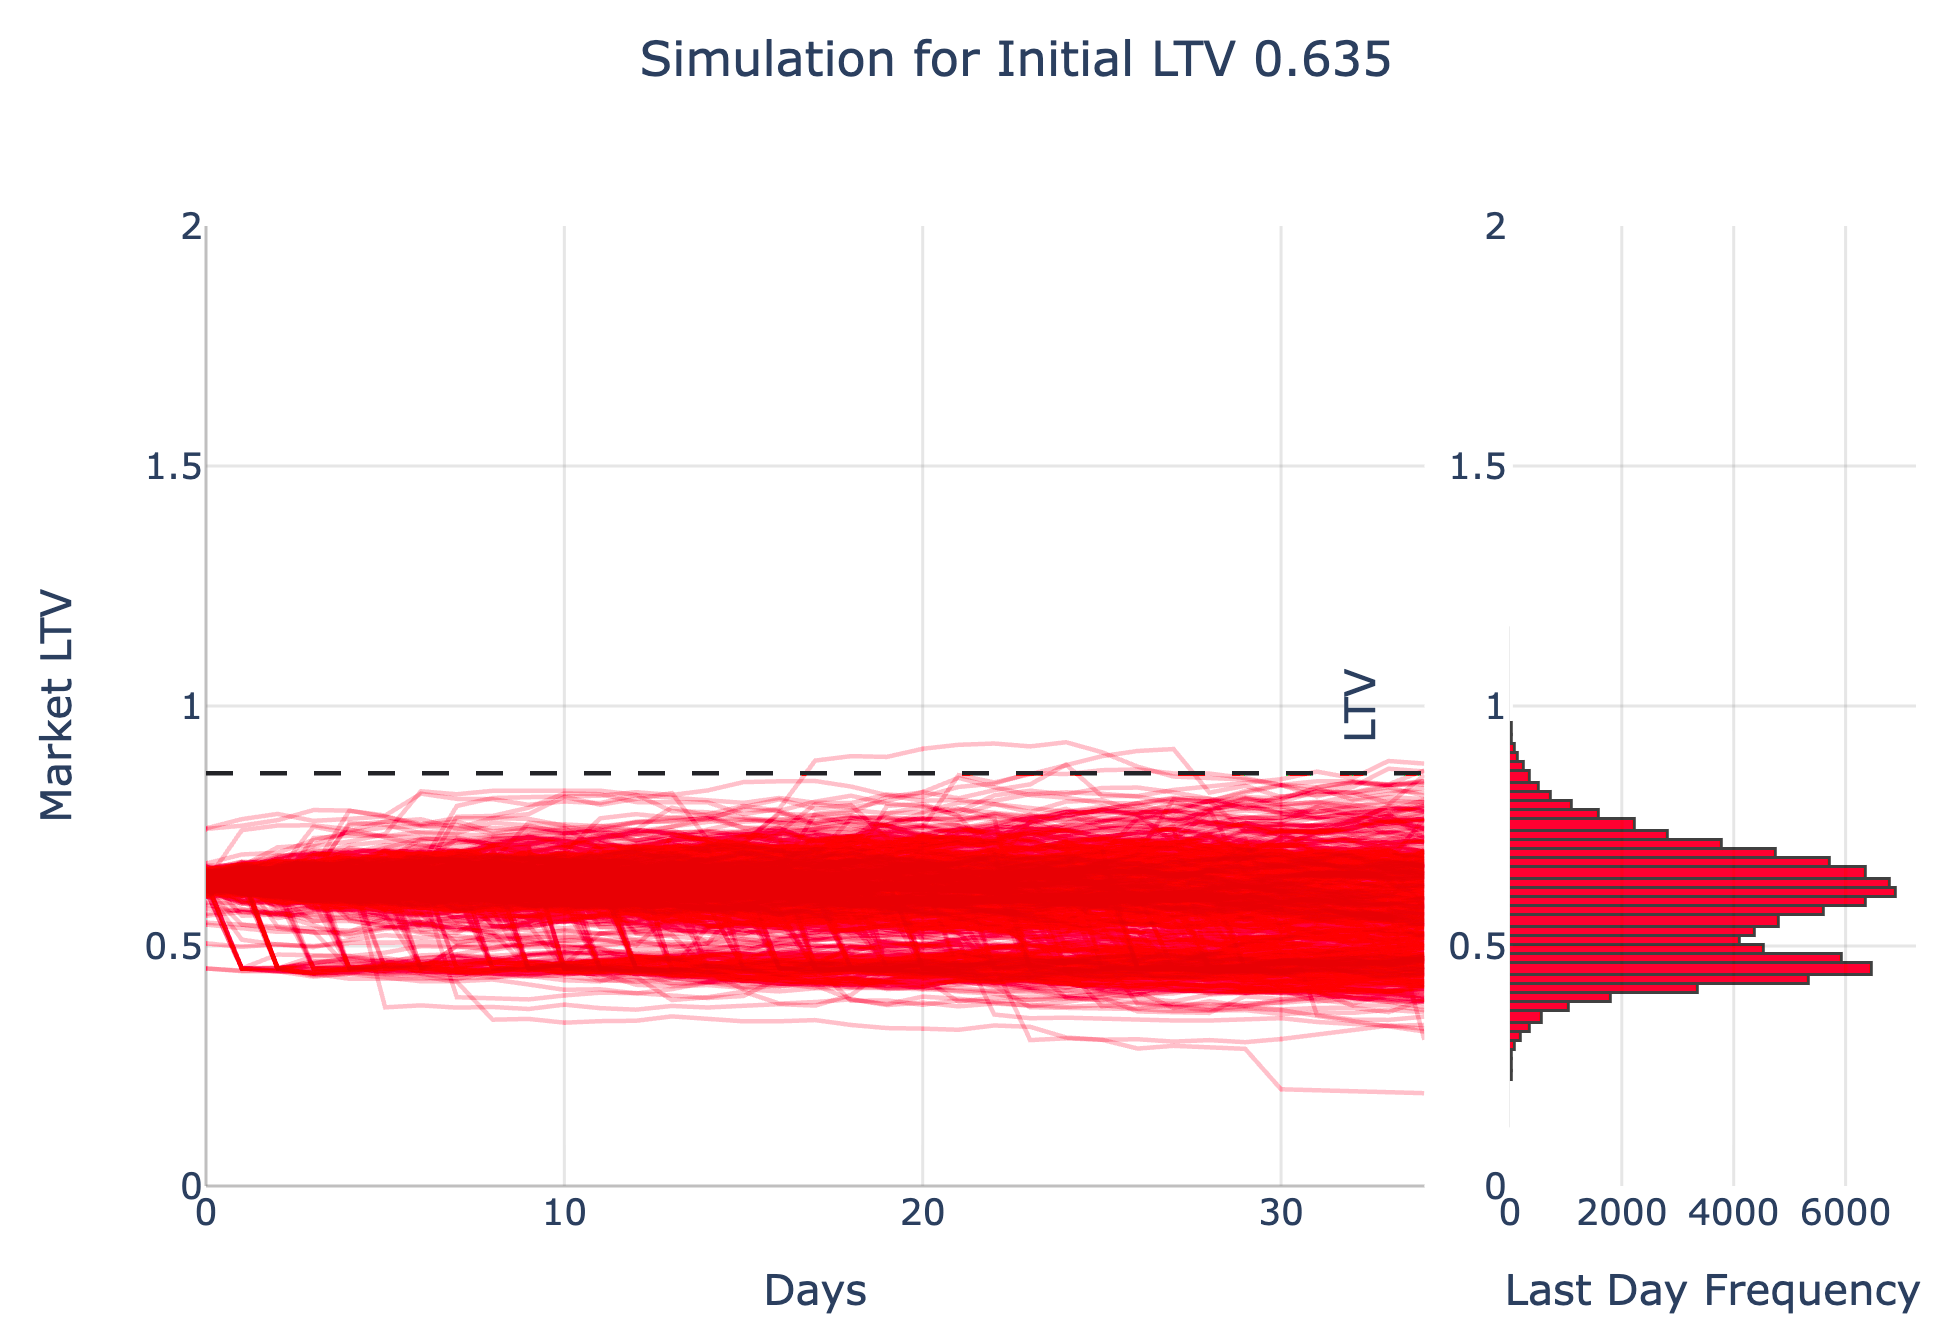
For exchange-based oracles where price feeds ignore market trading, simulations focus on credit events which can drive meaningful shifts in the redemption value of an asset. The daily volatility and historical tail events components of the price distribution are suppressed, which all else equal reduces the probability of liquidation.
Step 3: Incorporating Borrower Behavior
To reflect real-world usage, we incorporate actual borrowing behavior:
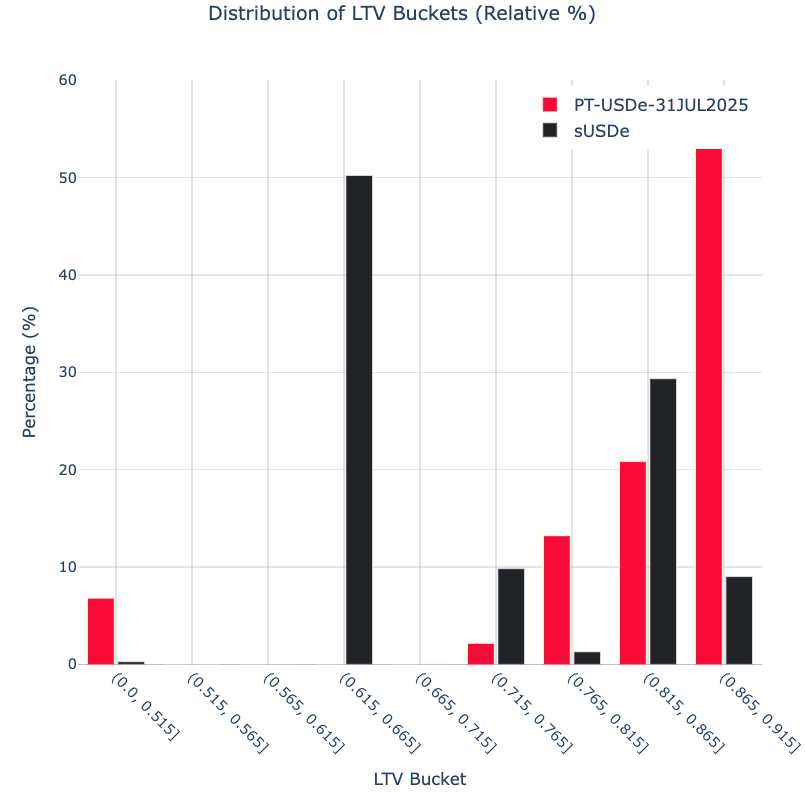
- We look at the distribution of loan activity, broken into LTV buckets over a recent period.
- This helps contextualize how exposed each tranche is to liquidation risk.
- We incorporate modeling of borrower rebalance behavior, depending on the pair type.
In the below image, we can see that the majority of loans against sUSDe as collateral have relatively conservative LTVs versus those using PT-USDe.
Step 4: Modeling Liquidations
Once we simulate price paths, we can simulate potential liquidations. This requires inputs on:
- Incentives: How are liquidators compensated?
- Liquidity: How much of the asset is available to liquidate?
- Volatility: How does changing volatility impact liquidity?
- Supply Pressure: Are there other markets or sources of potential liquidations?
Here’s a base liquidity curve for a USDC vs. cbBTC on base, which considers individual data points captured over 30-days (aligning to the base volatility input).
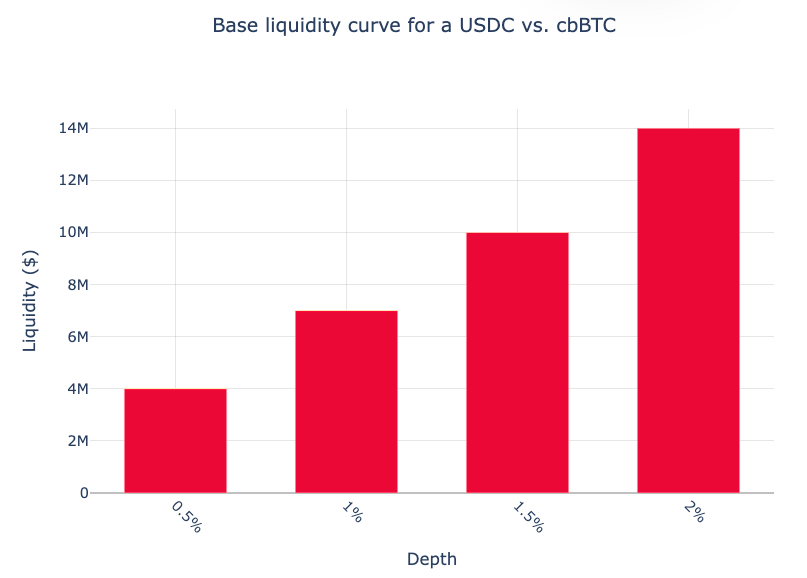
Liquidations happen as a step function — multiple tranches can be triggered at once and compete for the same liquidity. Effectively, if there is a large daily price move, a larger quantity of liquidations will chase the same available liquidity.
From the liquidation simulations, we capture events where bad debt occurs and exceeds our defined threshold (1% of principal). The final PSL for the market is calculated as: PSL = Bad Debt Price Paths / Total Price Paths
Step 5: Protocol & Oracle Adjustments
Two additional risk factors are applied at the market level:
- Morpho Protocol Risk: Consider the exploit probability of the Morpho protocol independently.
- Oracle Risk: Adjusts for unknown oracle vendors and misalignment.
After the adjustments, we have the final market PSL. To recap, our analysis encompasses:
- Oracle Configurations
- Collateral Asset Risk
- Asset Pair Volatility
- Borrower Behavior
- Liquidation Incentives
- Liquidity
- Protocol Risk
The below tables display Market PSL outputs for the Spark vaults.
Spark DAI
| Collateral Asset | Allocation % | Market PSL |
|---|---|---|
| PT-USDS 14AUG2025 | 72.7% | 0.13% |
| PT-sUSDE 31JUL2025 | 13.2% | 0.77% |
| PT-eUSDE 29MAY2025 | 2.1% | 0.81% |
| PT-USDe 31JUL2025 | 1.7% | 0.77% |
| sUSDe | 1.7% | 0.41% |
| USDe | 0.9% | 0.28% |
| PT-sUSDE 29MAY2025 | 0.3% | 0.77% |
| PT-sUSDE 27MAR2025 | 0.1% | 0.13% |
| Unallocated | 7.1% | 0.13% |
Spark USDC
| Collateral Asset | Allocation % | Market PSL |
|---|---|---|
| cbBTC | 100% | 0.13% |
Step 6: Composing Vault Ratings
Once all market risks are modeled, we aggregate them at the vault level. This includes:
- Vault Allocation Across Markets: Weighted average of market risks.
- Curator Behavior: Objectively assessed based on onchain activity within Morpho.
- User Protections: Structural features (guardians and time locks) that reduce risk for depositors.
Curator Behavior and User Protections are applied as adjustments on the weighted average PSL across vault allocations, resulting in the final ratings outputs.
| Vault | Network | Loan Asset | Rating | PSL |
|---|---|---|---|---|
| Spark DAI Vault | Ethereum | DAI | A- | 0.50% |
| Spark USDC Vault | Base | USDC | A | 0.18% |