DeFi Rating Scale
All Credora ratings are displayed in the Credora Rating Scale. A single, quantitative standard for comparing exposure across protocols, assets, markets and vaults:
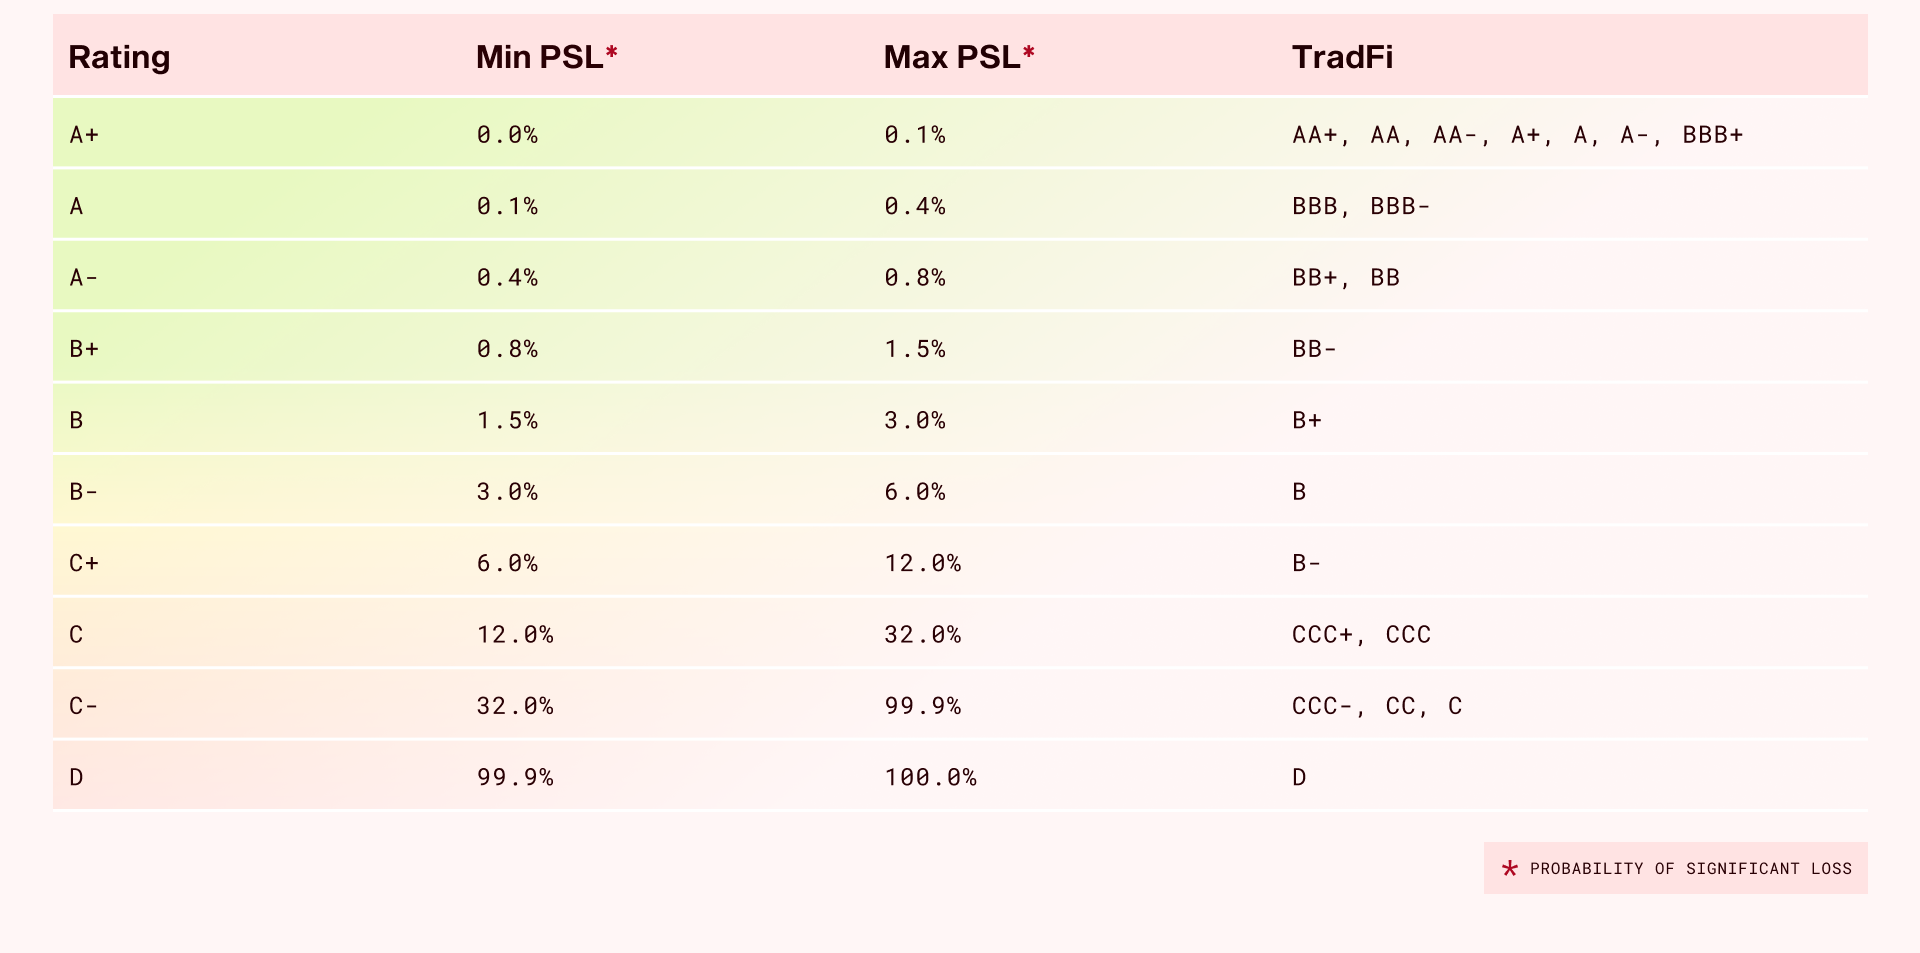
The rating scale is designed to maximize differentiation across DeFi products while remaining easy to read and interpret. As benchmarks, tokenized treasuries such as BUIDL are assigned an A+ rating, while as of the date of the document Morpho vaults and markets begin at an A rating.
Deriving the DeFi Rating Scale
All Credora methodologies rely on the Credora PD Curve, a uniform underlying probability of default curve. The curve fundamentally enables a comparison of risk across various Credora methodologies (Lending Markets, Vaults, Derivative Tokens, Stablecoins, etc.) and enables direct comparisons between Credora ratings and credit ratings assigned by traditional rating agencies. Traditional rating agency ratings scales are widely ingrained in the financial system and recognized by institutions and individual market participants. The Credora PD Curve is derived from analysis of the historic realized defaults across debt issuances rated by major US ratings agencies, including S&P, Moody’s, and Fitch.
Calculation
Credora starts by comparing the one-year global historical default rates by the three major credit agencies for each rating tier. The underlying data set spans at minimum 1990 to 2023, and therefore includes different credit cycles. Although the rating scale designations differ slightly across ratings agencies, Credora normalizes them on a single rating scale. Average default rates across major agency rated issuers and issuances are calculated for each rating tier, and a curve is interpolated. The image below shows the Credora PD Curve and the three rating agencies' historic realized default rates.
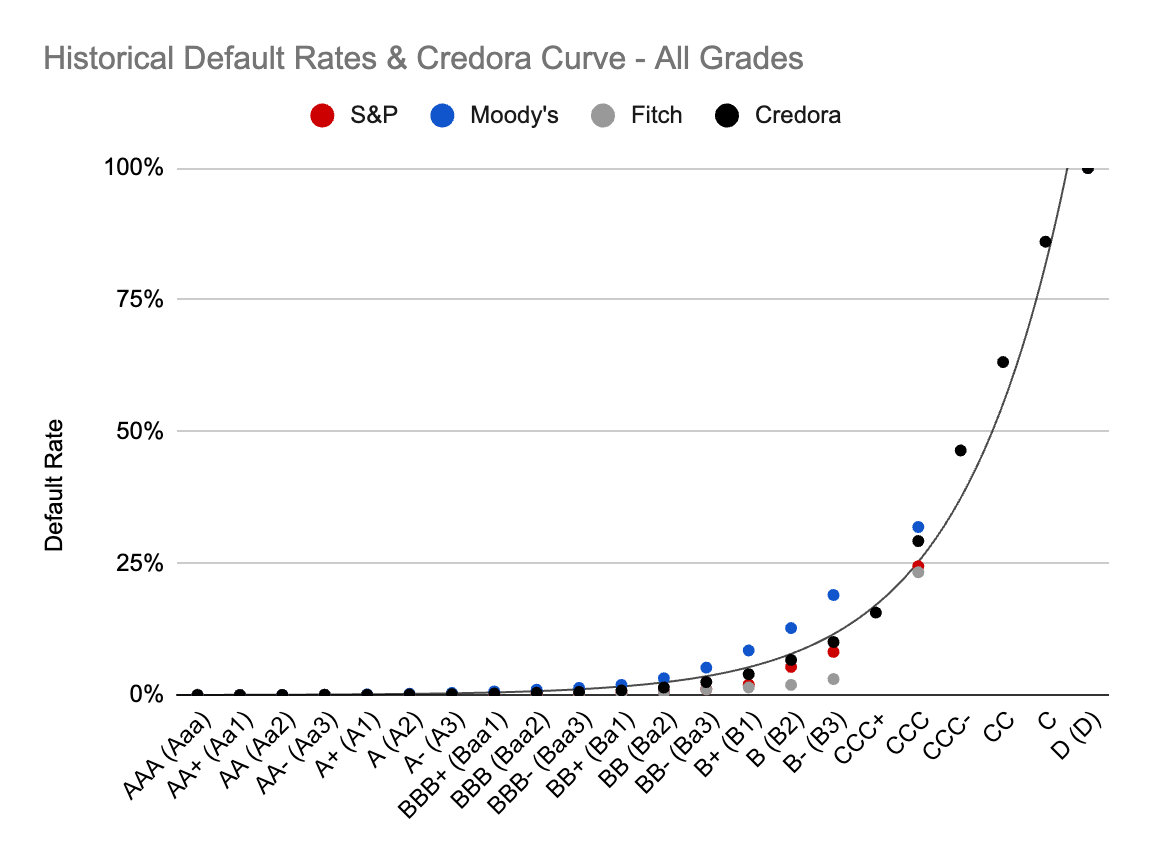
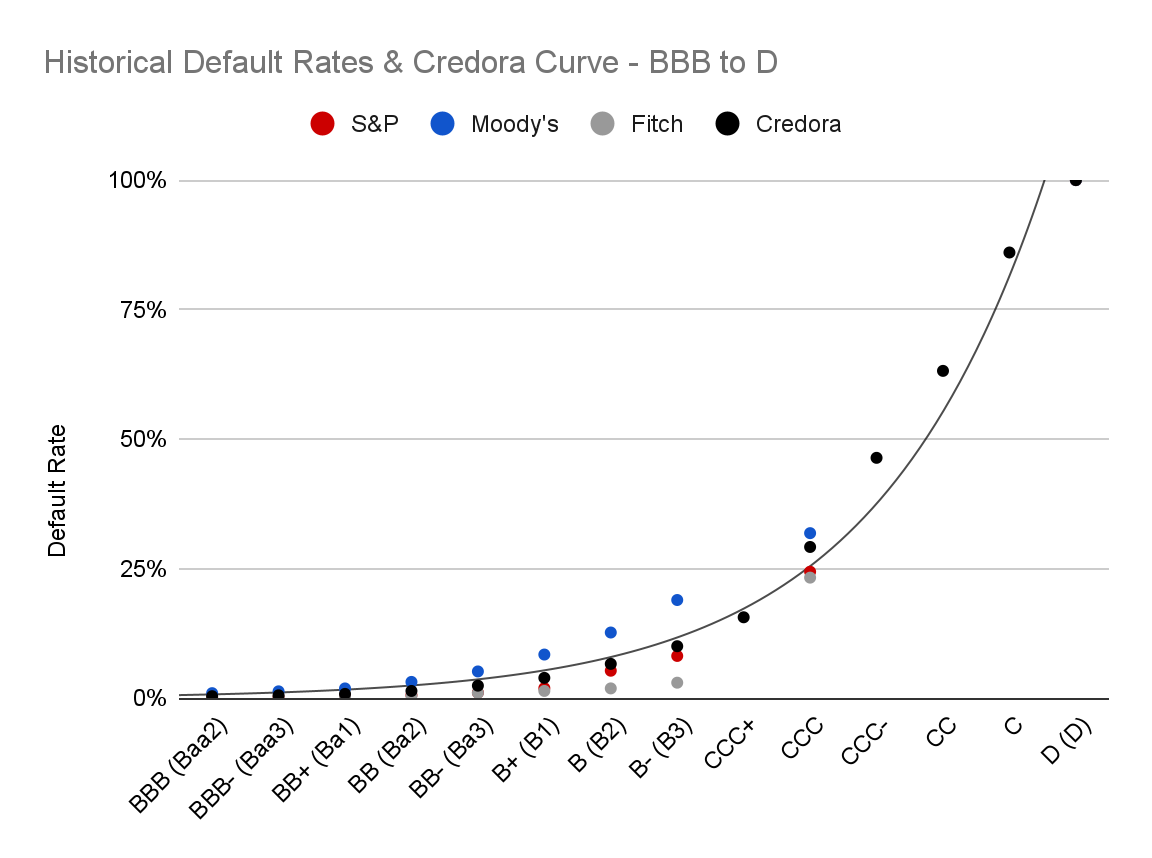
Credora uses exponential interpolation to define a function for the curve equation. The objective is to fit the data to an exponential model of the form , where y is the value at observation x, a is a scaling factor, and b represents the growth rate, fitted to the data points. Because agencies combine the realized C, CC and CCC default rates in aggregate, an intermediate exponential interpolation is used to obtain the points for CCC+, CCC-, CC and C. Based on this formula, the Defi Ratings Table provides a discretized version of the Credora PD Curve. The PD ranges are optimized to enhance risk differentiation within the portion of the curve where the majority of the DeFi landscape operates.