Loan Pairs with Isolated Collateral
Encompasses Morpho Markets. The key characteristic is the one-to-one relationship between a collateral asset and loan asset, where the collateral itself is not used elsewhere.
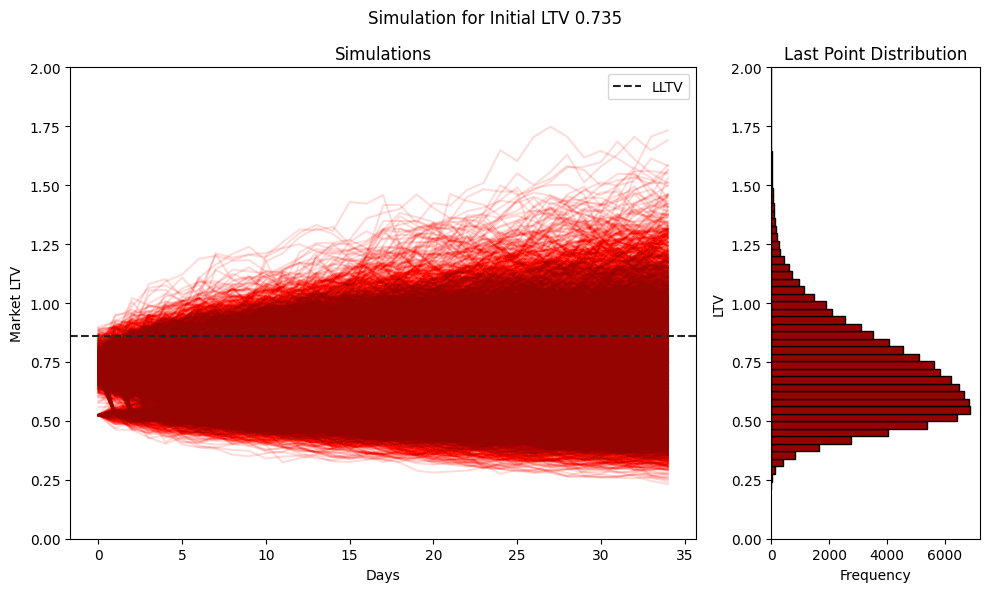
Monte Carlo simulations are used to model the behavior of complex systems by generating numerous random scenarios, resembling real-world complexity. The Loan Pair Simulations model generates random daily returns directly on the pair price, defined as the loan asset price divided by the collateral asset price. These daily returns factor in dynamics including pair volatility, historic tail events, and collateral default scenarios. The approach generates pair price projections over a 30-day simulation horizon. These are applied to initial Loan-To-Value (LTV) tranches to forecast LTV changes over time.

Parameters
Market configuration parameters, specifically the LLTV and LIF, are utilized as direct inputs in the simulation. Additionally, the distribution of loans in a specific pair is segmented into bins or tranches for the purposes of the Loan Pair Simulation and Liquidation Simulation.
LLTV
The Liquidation Loan-To-Value (LLTV) is a threshold used to determine when an account becomes unhealthy and is subject to liquidation. It represents the maximum allowable ratio of borrowed assets to collateral value. If a borrower's Loan-To-Value (LTV) exceeds the LLTV, their position can be liquidated.
LIF
The Liquidation Incentive Factor (LIF) is a mechanism that rewards liquidators for repaying a borrower's debt when their Loan-To-Value (LTV) exceeds the Liquidation Loan-To-Value (LLTV). Different protocols will have different mechanisms for calculating LIF.
A higher LLTV results in a lower incentive factor for liquidations. Naturally higher LLTV market parameters are more frequently utilized where the market volatility of the pair is lower.
Loan LTV Tranches
The distribution of loans in a specific Pair is also a significant input into the simulation. The model relies on LTV tranches, which effectively segment all outstanding loans into bins according to their distance from the LLTV trigger. The outstanding loan amount per tranche is an input into the Liquidation Simulation.
For pairs where the allocation is below a certain threshold, the total borrowed amount is not sufficient to quantify the risk in a meaningful manner. The threshold for low allocation is established by calculating the 30th percentile across all pairs. Any pair whose allocation is below this cutoff (approximately $300,000 for the current morpho market size) is deemed Low Allocation.
When analyzing low allocation pairs, Credora relies on an expected allocation and distribution to ensure the rating remains meaningful. In such scenarios, the distribution of loans is pulled from a set of peer markets with similar characteristics, ensuring that low allocation markets have representative volumes that are sufficient to quantify the respective risk adequately. Peer markets share the same Loan-to-Value (LLTV) and loan/collateral pair category classification (for instance, “stable-stable” or “stable-volatile”). The average tranche distribution of these peer markets is then incorporated into the market simulation. This triggers the peer-based override of loan tranches, ensuring more robust simulation outcomes despite the smaller initial allocations.
Market Oracle Characterization
Markets utilize fundamentally different types of oracles, where oracle type influences the simulation framework. According to Credora nomenclature, these types are:
-
Dynamic Oracles: Capture the market price of the collateral asset versus the loan asset. In these pairs, liquidations and significant losses can result from temporary or sustained moves in the market price of the underlying collateral asset, whether driven by market dynamics or collateral asset default events. The historical volatility of the asset pair is a main driver in simulations, alongside collateral asset default events and market tail events.
-
Fundamental (or Exchange Rate) Oracles: Deliver prices which reflect the exchange rate between an asset pair, using redemption values and protocol-defined calculations. For example, a stETH to ETH exchange rate oracle would return the rate at which stETH can be redeemed for ETH. As a result, simulations reduce the base volatility input of the pair to 0%, recognizing that market volatility will not drive liquidations. Liquidations and losses can result from changes in the exchange rate, which may arise through collateral default events.
-
Hardcoded Oracles: Rely on a fixed price feed, rather than market activity. Due to their fixed or static nature, liquidations are only driven by accrued interest resulting in loans exceeding the LLTV. The No Liquidation Methodology below outlines how Credora quantifies a PSL in these scenarios.
Daily Return Profile
The pair simulation model relies on a Daily Return Profile per asset pair. In determining the daily return profile, extreme returns are separated from non-extreme returns and distinct modeling approaches are applied to each segment. This strategy allows for a focused and simplified approach to modeling the non-extreme returns, while the extreme events are handled using methods better suited for tail risk modeling.
Historic Volatility
A Normal Distribution is utilized for modeling non-extreme returns. This choice was driven by the central tendency and symmetry of non-extreme returns across asset pairs, which align well with the characteristics of a normal distribution.
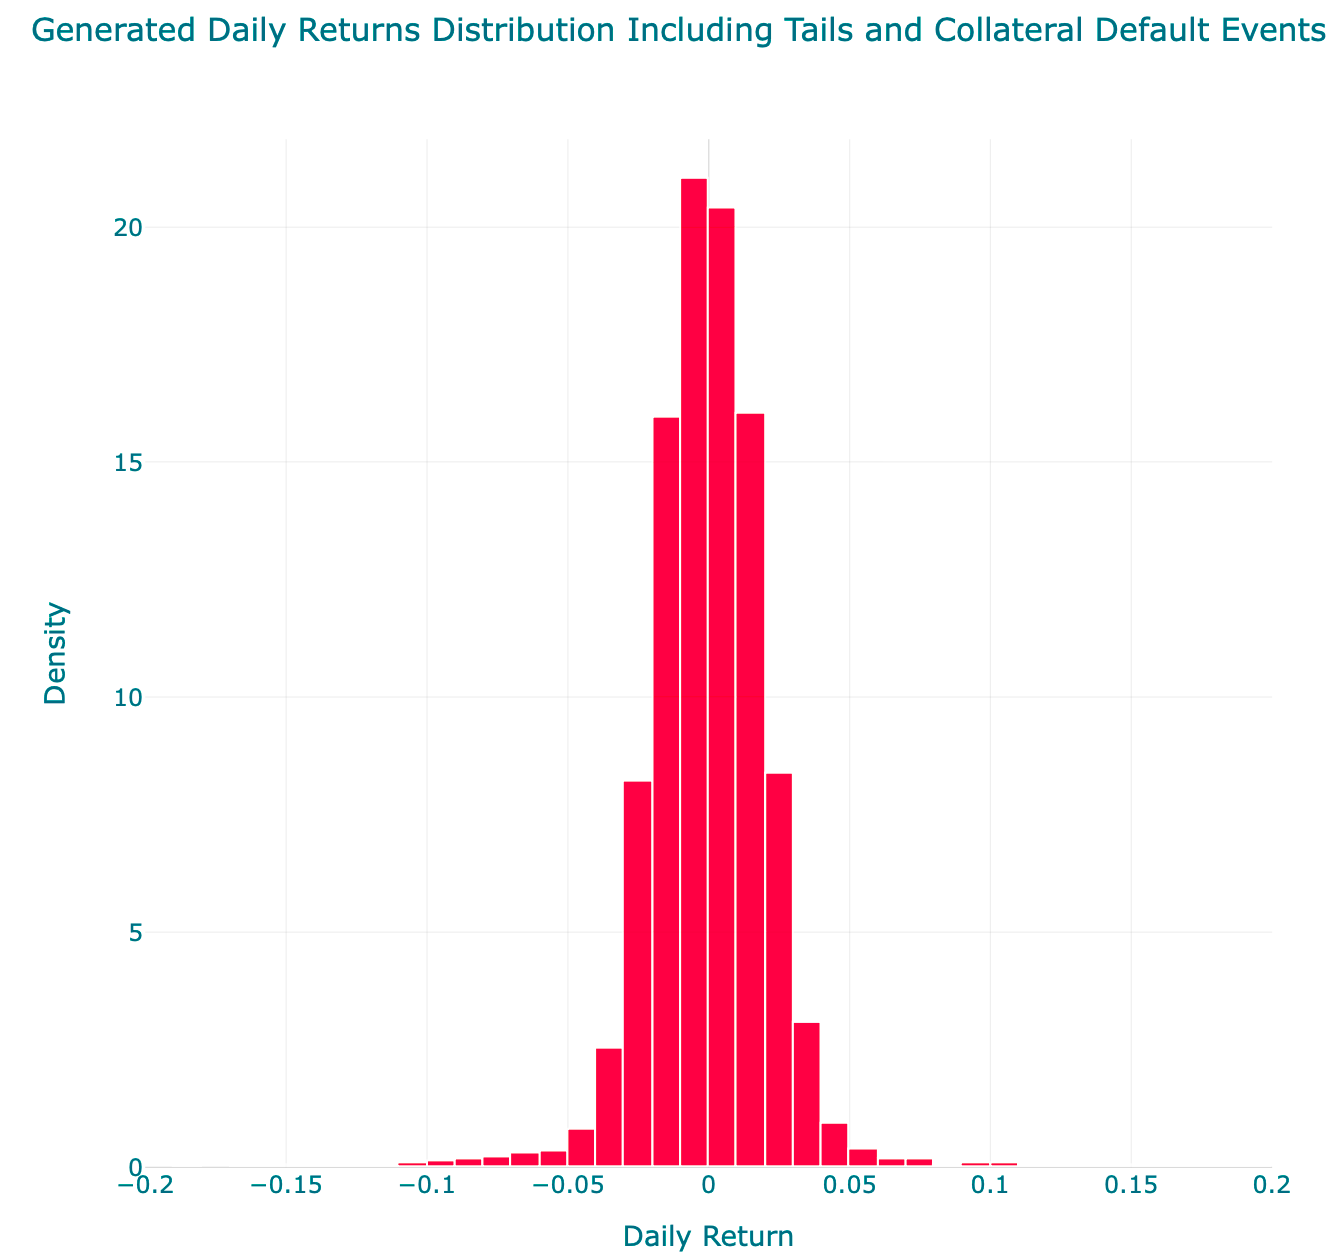
The image below presents an example of the generated daily returns distribution including historical volatility, market tail, collateral events and rebalance probabilities:
As an input parameter into the simulation, the 30-day historic volatility of the asset pair is used to model the non-extreme returns. In future iterations, the simulation is expected to rely on a function of historic and implied volatility, where there are multiple potential approaches for estimating on tokens relevant for Morpho Markets.
Tail Events - Generalized Pareto Distribution (GPD)
Credora's approach separately models extreme values exceeding a percentile threshold per asset pair. The threshold determination is based on the deviation of empirical distribution tails from a fitted normal distribution. For each pair price, Credora identifies the point where the historic data significantly deviates (or transitions) from the shape expected if it were normally distributed. This cutoff, which is applied for left and right tails, is identified based on an analysis of the past 5 years of price data. The figure below shows the application for the right tail of daily price returns.

The excess above the threshold is modeled using a Generalized Pareto Distribution (GPD), which is particularly effective for analyzing isolated extreme values beyond a high boundary. Credora utilizes a threshold-based approach, applying dynamic cut-off points derived from historical data as the thresholds to define extreme events per asset pair. For cases where the relevant asset pair has a limited history, a comparable underlying pair is used.

Collateral Default Events
In the event of a collateral asset default, the relevant asset pair can experience a significant price impact, affecting the LTV of active loans. Credora methodologies calculate the annualized probability of this event, represented by the PD of the collateral asset.
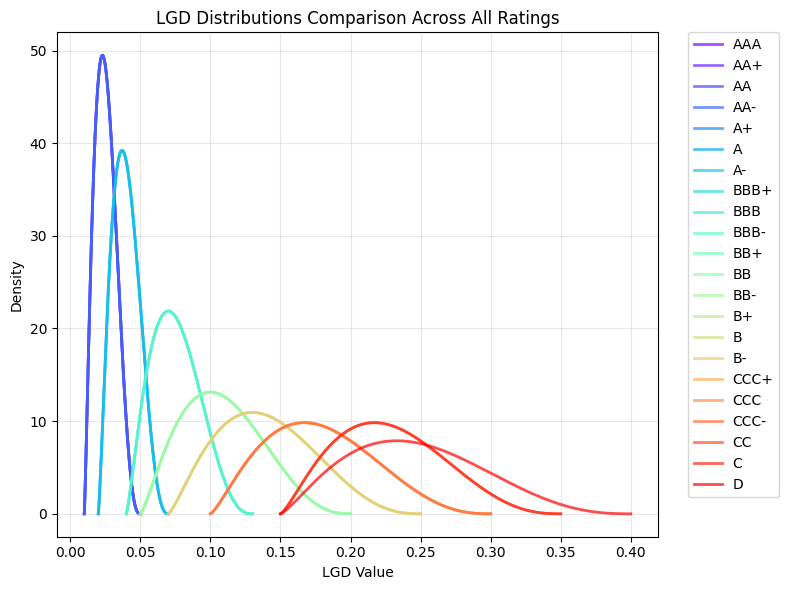
The expected impact on the asset price is determined by a Loss Given Default (“LGD”). Credora converts a base LGD into a beta-PERT Distribution, a common distribution for modeling losses from default events. The below table demonstrates the LGD input as a function of the implied rating.
The following image shows the generated beta-PERT Distributions for LGD values per S&P rating, which is then translated into the DeFi Rating Scale:
For a specific market, the modeled tail determined by an analysis of historic price behavior is supplemented by generated tail events which consider the PD and LGD calculated for the collateral asset. Historically, although there are multiple instances of solvency concerns driving price volatility in stablecoins and other frequently utilized collateral assets, there are limited realized historic default events. This approach captures the potential impact of solvency concerns, represented by historic market tail events, and the potential impact of default events, calculated by the relevant Credora token methodology.
Rebalancing Parameters
The Rebalance Model considers borrower behavior, recognizing that borrowers are incentivized to rebalance their positions (e.g. deposit additional collateral) as the risk of liquidation increases. The probability of market rebalance on a given day is modeled using a logistic regression model. The model predicts the likelihood of additional collateral deposit by a borrower on a given day. The logistic model takes the following as inputs:
-
The Health Factor based on the close prices of the previous day. Health Factor is defined as the USD value of collateral multiplied by the LLTV, divided by the USD value of the loan. This variable captures the liquidation risk of the position.
-
A binary variable encoding the type of loan pair. This is used to distinguish pairs where the underlying borrow and loan assets are highly correlated (e.g. WETH/wstETH) from pairs where the assets are less correlated (e.g. WETH/USDe). This variable reflects the intuition that borrowers are more likely to proactively rebalance where their expectation of volatility is higher.
When a simulated collateral deposit occurs, the magnitude of impact is a fixed parameter expressed as a percentage reduction of LTV. The magnitude is informed by historical averages of borrower behavior.
LTV Simulations
The Daily Return Profile drives price simulations, which are utilized to calculate the evolution of loan-to-value (LTV) ratios over a specified number of days and simulation runs, under varying market conditions. The Rebalance Model is applied on the LTV Simulations, more accurately capturing user behavior. The primary objective is modeling how frequently loans are expected to breach the LLTV.
Loan Pair Simulation Outputs
The Simulation Model returns aggregated information on Trigger Events, or incidents when the LTV surpasses the LLTV. The outputs are used as inputs for the Liquidation Simulations, which analyze the probability of trigger events leading to bad debt.
The core outputs include the following:
-
Monthly Probability of LLTV Trigger per Tranche: Represents the probability of any liquidation trigger event occurring in a 30-day period, for a given LTV tranche. It is calculated as the number of unique trigger events divided by the total number of price simulation paths.
-
Trigger Volatility: The volatility of all Trigger Events, which is utilized in the Liquidation Simulation for modifying liquidity.
-
Post-Trigger Returns: The price path of a specific Trigger Event following the Trigger Event.
Liquidation Simulations
Liquidation Simulations isolate the Trigger Events for further analysis. These simulations rely on multiple inputs, including the LIF, Loan LTV tranches, and multiple liquidity parameters. The Liquidation Simulation quantifies a PSL by analyzing the quantity of incidents where Bad Debt exceeds the 1% threshold. LTV tranches inform the amount of collateral eligible for liquidation in a specific Trigger Event.
Step Function
While Loan Pair Simulations generate daily price changes, liquidations occur on more granular time frames. Liquidation Simulations utilize a Step Function, which segments a daily price move into multiple linearly spaced intraday price moves. This allows for the simulation of multiple liquidation events in a single day, more accurately modeling market behavior.
The time and LLTV where a liquidation was triggered determines the starting point for the Step Function. For a specific daily price move, subsequent steps result in uniform increase in price over a set period of time. The number of steps is a fixed input, where x steps indicates that over the course of a day, the model performs x liquidations. Successful liquidations reduce the outstanding loan amount, and therefore have an impact on the LTV. As a result, although the Step Function segments into linearly spaced price moves, the impact on LTV is non-linear.
As an example, consider a market where the LLTV is 86%. The Loan Pair Simulation results in multiple Triggers for the 81 - 86% LTV tranche. From the base Loan Pair Simulation, the price move driving the Market Trigger results in an LTV of 90%. The model applies a Step Function of 8, and the price move driving the increase from 86% to 90% LTV is segmented accordingly. In each segment of price increase, the model simulates a liquidation, considering the notional amount to be liquidated and the available liquidity. This allows for a recalculation of the LTV, before the subsequent liquidation is applied. After the step function completes, there is a new LTV which is <90% (assuming successful liquidations). The process repeats applying the subsequent day’s simulated price moves, until the loan tranche is fully liquidated or the path results in bad debt exceeding the threshold.

Credora aggregates across step PSL outputs (e.g. 3, 6, 9, 12, etc.) to determine the final PSL for a loan pair. PSL outputs are assigned a rating rank, which is determined using a linear interpolation of the corresponding rating PD range. The average rating rank is calculated across multiple step outputs and subsequently mapped to the final PSL. A rating rank is used because of the exponential nature of the underlying PD curve, as simple averages of the PSL outputs more heavily weight the impact of lower step results. This approach ensures that the output considers a range of possibilities across intraday price move volatility, and drives stability in the outputs.
The number of steps is undergoing optimization, alongside other simulation parameters. Currently, Credora is evaluating outputs for 3 - 21 steps. Indicative results consider outputs across this range.
Liquidity Parameters
Liquidity parameters are calculated independently for each loan pair. Credora’s process defines a Base Liquidity that is subsequently modified considering the characteristics of the pair and conditions driving the Trigger Event.
Base Liquidity
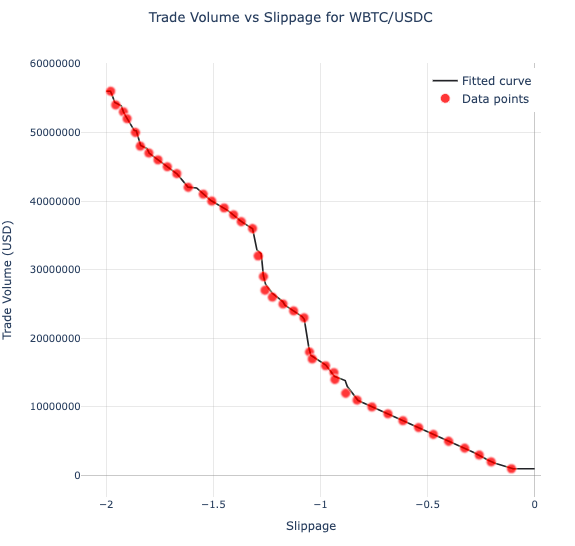
Credora repeatedly queries DeFi pricing data for relevant asset pairs from 1Inch and 0x. This enables the building of a liquidity curve, where the USD amount of available liquidity is considered versus the slippage from the loan pair mid-price. The loan pair mid-price is currently queried from Coingecko, and also independently calculated for 1Inch and 0x. For 1Inch and 0x, the price of executing the sale of 1 unit of collateral is used as the mid-price. In querying the data sources to build curves, Credora dynamically adjusts the notional amount based on the prior results, aiming to ensure adequate data points are captured across 0-2% slippage for all pairs.
The Liquidation Simulation utilizes averages of liquidity observations over the prior 30-days across 1Inch and 0x, combining short and long-term moving averages. Versus only relying on the latest liquidity metrics, this approach smooths the impact of short-term liquidity changes, and is generally aligned to the time frame for volatility inputs.
In the Liquidation Simulation, Credora allows a maximum of 0.5% slippage. Analysis indicates that beyond 1% slippage, market depth data becomes increasingly volatile and therefore less reliable.
In the initial implementation, the above maximum slippage diminishes the importance of considering the economics of a liquidation. Practically, the LIF drives incentives for liquidators, and it is dependent on the LLTV set per market. Additionally, in advance of executing a liquidation, liquidators rationally consider the cost of executing a trade (e.g. DEX transaction costs, network costs) versus the incentive for performing the liquidation, typically targeting a profit margin for their services. Credora is further exploring these variables, and evaluating their impact on the accuracy of the outputs.
Volatility Adjustment
Credora adjusts liquidity metrics to account for the relationship between the historical volatility of asset pairs during extreme or stressed market conditions and the 30-day volatility input utilized in the Loan Pair Simulation framework. This adjustment is derived from an independent analysis that evaluates the impact of volatility on liquidity dynamics across various asset pairs.
The process uses the last three years of historical price data to isolate the 95th percentile of daily price movements and calculate the volatility during extreme market conditions. Subsequently, the ratio between this extreme volatility and the historical volatility over the past 30 days is calculated. Finally, this ratio is applied to a curve that determines the appropriate liquidity discount. For typically volatile market pairs, the discount in liquidity is on average between 20% to 50%.
This liquidity adjustment aims to capture the reality that liquidity is dependent on market conditions. Recent liquidity levels are shaped by prevailing recent market volatility, with the disparity between recent volatility and that observed during extreme market events serving as a key indicator in the model. This gap informs the additional discount necessary to adjust liquidity, ensuring it accurately reflects expected values under stressed market conditions.
Market Tier Adjustment
Liquidity is further adjusted depending on the utilization of the collateral asset across similar loan pairs from the most relevant lending protocols. The Market Tier Adjustment aims to capture the risk of liquidations occurring simultaneously across multiple markets, therefore reducing the available liquidity for liquidations or more drastically impacting price.
First, a discount is applied considering similar loan pairs within the protocol. Additionally, assets are tiered based on the utilization of collateral across major DeFi protocols, including AAVE and Spark. The usage of the collateral determines a tier, which is mapped to a percentage liquidity discount.
In future iterations, the Market Tier Adjustment will be enhanced and calculate values at risk of liquidation across multiple protocols, considering a specific asset or pair price move. This enhancement is targeting a more accurate measurement of the liquidity available for a specific liquidation, or the higher potential for more aggressive price moves.
Liquidation Simulation Outputs
The following are the core outputs of the Liquidation Simulation.
-
Expected Bad Debt per Scenario Trigger: Represents the notional amount of bad debt per Trigger Event. This is utilized to calculate the Monthly PSL.
-
Monthly PSL: Represents the probability of experiencing a significant loss event in a 30-day period. It is calculated as the number of significant loss events divided by the total number of simulations.
The Monthly PSL is annualized for the purposes of comparison versus Credora PD outputs. The formula for this is as follows: .
The approach for quantifying a PSL and implied rating considers multiple factors, including the parameters of the relevant loan pair, the recent state of active loans, the volatility of the asset pair, historic extreme price events, default events calculated utilizing Credora methodologies, rebalancing behavior, liquidity, and liquidity adjustments. In aggregate, this represents a comprehensive which considers a variety of market and tangent risks.
No Liquidation Pairs
Loan Pairs that rely on a fixed price oracle are designated as No Liquidation pairs. These configurations typically accompany stable-stable pairs, for example USD0/USDC, where price moves are typically mean-reverting and the use of a dynamic price oracle exposes borrowers to a higher frequency of liquidations.
In pairs relying on dynamic oracle pricing, liquidations and significant losses can result from temporary and sustained moves in the market price of the underlying collateral asset, whether driven by market dynamics or collateral asset default events.
In no liquidation pairs, however, risk primarily stems from collateral asset default events that are expected to be the driver of sustained changes in the price of the collateral asset. Fixed price oracles are often utilized in pairs where the collateral asset and the loan asset are redeemable against the same reserve asset (e.g. WBTC/cbBTC). Temporary deviations in the asset pair price does not lead to liquidations or significant losses as the oracle price is fixed. Historically, prices of such pairs are typically mean reverting and deviations are impermanent. As a result, sustained losses are expected to be primarily driven by collateral default events. As such, Credora employs a nuanced approach to measuring the risk of No Liquidation Pairs. This approach emphasizes the importance of collateral default events as the primary source of significant loss risk whereas the impact of market moves stemming from the materialization of market tail events is diminished to capture the historically mean-reverting behavior.
Credora quantifies the PSL for No Liquidation pairs via the following approach:
-
Define the necessary price move that can lead to significant losses as 100% - LLTV, a conservative assumption considering LTV levels are typically lower than the LLTV in markets.
-
Isolate the risk of collateral asset default events as the primary source of significant loss. The probability that the loss given default (LGD) will exceed the necessary price move is measured. This is achieved by calculating how many LGD observations lie above the necessary price move, expressing it as a percentage of all observations, and then multiplying by the probability of a collateral default. The result of this calculation measures the probability of significant loss due to a collateral default event.
-
Isolate and measure market tail risk by calculating the annual probability that price moves exceed the threshold. The result of this calculation measures the probability of significant loss due to a market event or a price move that will be sustained, without a collateral asset default event.
-
Combine these elements by adding the probability of significant loss due to a collateral asset default event of significant loss due to a market event. This combination offers a balanced estimate of the chance that large, sustained price changes occur without a corresponding material default.
Market Level Modifiers & Adjustments
Upon generating the Probability of Significant Loss (PSL) outputs from the simulations, an additional modifier and adjustment are applied to account for bespoke, market-specific risks. These are critical in enhancing the robustness of the risk assessment process for markets.
The Oracle Risk Modifier addresses risks stemming from misconfigured oracles, reflecting the potential for inaccurate or unreliable price feeds. This includes misaligned pricing mechanisms, reliance on static or hardcoded prices, and risks associated with unverified or opaque oracle vendors. These vulnerabilities, if unaddressed, can undermine the integrity of price discovery, introducing systematic risk into the protocol.
The Protocol Adjustment accounts for operational and smart contract risks inherent to the underlying network where a given market operates. This adjustment evaluates the risk of operational inefficiencies or smart contract vulnerabilities that may amplify a market's exposure to significant loss.
Oracle Risk Modifier
The Oracle Risk Modifier Framework introduces a structured, transparent methodology for adjusting the Probability of Significant Loss (PSL) in response to identified oracle risks. This framework evaluates risks across two key dimensions:
-
Hardcoded or Misaligned Oracle Risk: This dimension captures risks associated with oracles that rely on static pricing (hardcoded values) or pricing misalignments resulting from poor configuration. Both issues can lead to significant inaccuracies, especially during volatile market conditions. In both scenarios, the failure to dynamically and accurately track the relationship between collateral and loan assets introduces vulnerability to price manipulation or mispricing.
-
Vendor or Configuration Uncertainty: Exposure to unverified, opaque, or poorly vetted oracle providers that may compromise price feed integrity or introduce manipulation risks. Likewise, unknown configuration contracts pose risks, which are captured through this risk factor.
For each dimension, a notch adjustment is applied based on the severity of identified risks. Notch adjustments range from 0 (no impact) to -0.6 (maximum negative impact). The final oracle risk adjustment is determined by averaging the notches across the two dimensions, ensuring a balanced and proportional reflection of oracle-related vulnerabilities.
This methodology ensures that market-specific oracle risks are systematically identified, quantified, and incorporated into the PD analysis, strengthening the overall risk assessment process for markets.
Hardcoded or Fixed Price Risk
This risk emerges from either static (hardcoded) price feeds or misaligned oracle configurations. Both scenarios fail to adequately reflect the dynamic relationship between collateral and loan assets, particularly under volatile market conditions. For investment grade rated assets, robust redeemability is a key expectation, reflecting their strong creditworthiness and structural reliability. Accordingly, in markets exposed to such assets that rely on pricing derived directly from the underlying collateral (e.g., WBTC utilizing a BTC price feed or USDC referencing a USD price feed), the oracle configuration is not deemed misaligned and the market is not adjusted downward based on the oracle risk.
| Tier | Description | Notch Adjustment |
|---|---|---|
| Tier 1 | Oracle directly tracks the relationship between collateral and loan assets or there is no reliance on hardcoded oracles. | 0 |
| Tier 2 | Oracle indirectly tracks the relationship or there is reliance on hardcoded oracles. | –0.6 |
Unknown Vendor Risk
This risk arises when the oracle provider or vendor is unknown, unverified, or operates with insufficient transparency. The lack of visibility into the vendor's operations, infrastructure, and governance can lead to significant vulnerabilities for the protocol relying on its price feeds.
| Tier | Description | Notch Adjustment |
|---|---|---|
| Tier 1 | The vendor is established, well-known, and transparent. | 0 |
| Tier 2 | Vendor is unknown or lacks sufficient documentation or transparency about its operations. | –0.6 |
Final Notch Adjustment
To determine the final notch adjustment, the framework calculates the average of the scores across the two risk categories. This approach ensures a streamlined and proportional adjustment, effectively capturing the cumulative impact of oracle-related risks on the market. The resulting final adjustment provides a balanced and comprehensive measure of the overall oracle risk profile, facilitating a clear and consistent integration into the market's PSL assessment.
Example Scenario
The below represents a WETH/WBTC market, where WBTC is the collateral asset.
| Oracle Component | Status |
|---|---|
| Base Feed | BTC/ETH |
| Quote Feed | None (hardcoded price) |
| Vendor | Chainlink |
The modifier is applied as follows:
| Factor | Description (Notch Adjustment) |
|---|---|
| Misaligned Pricing Risk | BTC/ETH feed for WBTC/WETH market (0) |
| Hardcoded Price Risk | Quote feed is hardcoded, but the asset rating is high and redeemability is robust (0) |
| Unknown Vendor Risk | Vendor is known and credible (0) |
| Final Notch Adjustment | 0 |
Protocol Risk Adjustment
The Protocol Risk Adjustment evaluates the smart contract exploit risk inherent in the protocol. A PD on each market exposure is derived from a Smart Contract risk assessment.
The final Market PSL is calculated after accounting for the two additional risks: oracle risk via the Oracle Modifier, and general smart contract risk via the Protocol Risk Adjustment. After the Oracle Modifier is applied to the respective market PSL, the Protocol Risk Adjustment is modeled using the following formula.
Final PSL = (Adjusted Market PSL + Morpho Protocol PD) - (Adjusted Market PSL * Morpho Protocol PD)